Searching for signals
For this analysis logged data of
some days of September 2015 were taken, with the purpose of finding out if
there is any significant radio source detectable with the previously described
(see older post) handmade radio telescope and a 4m diameter parabolic dish. A
complete sky scan is being made, which will probably take some weeks (or even
months). Within this post we take first a look on declination -2° 22'.
Declination -2° 22'
The following plot shows the software detector data for the 7th September 2015.
The plot includes two different
representations of the recorded data in these 24 hours. The X-axis contains the timestamp in local form. The Y-axis of the upper
plot shows the calculated power in every scan on basis of a developed algorithm,
which makes a conversion of the real scan (1420 to 1421MHz) to a flatted scan,
tries to recognize the existence of a signal on it and integrates the area of
the found signal as a result. For the current scanned sky position (RA-DEC) a possible
detectable radio source extracted from 1420MHz catalogue in http://vizier.cfa.harvard.edu/ is
logged and shown vertically (mostly not really readable on a 24 hours plot). The color of the text depends on the flux of the source, in Jy. The plot below shows in the left Y-axis
the frequency band of found signal on scan, with his corresponding bandwidth on
the right side.
For a better recognition of
detected radio sources it is always necessary a comparison of data of different
days, so that the expected time shifting of 4 minutes per day is obvious.
The next picture includes the 7th and 9th September:
 |
| 24 Hours Plot of 7th and 9th September 2015 |
A catalogue of radio sources on 1420 MHz indicates for 3C29 (RA 00h 55min and DEC -01° 42') a Flux of 7Jy.
 |
| Radio Sources Catalogue extract with 3C29 |
 |
| Sky on 7th Sept 2015 at 00h 25' 37'' UTC for RA 00h 55' DEC -2° 22' (Antenna Focus) |
02h 13in UTC, 3C71 ?
Observing the time period between 02:00
and 02:30 UTC we appreciate the peak caused by a signal centered on
1420.5 MHz. The sky view on this time for the scanned area shows several
sources, being the starkest one 3C71 or M77 (NGC 1068). This source still lies more
than 1° above the antenna focus.
 |
| Zoom of plot for a better analysis around 04:13 local or 02:13 UTC |
A search through the scanned area with
planetarium software lets us guess it could be M77 or even 023507-040205, a
very faint radio source, catalogued with just 1495.3 mJy.
 |
| Sky on 7th Sept 2015 at 02h 13' UTC for RA 02h 55' DEC -2° 22' (Antenna Focus) |
PSK0336-01, 3C89 ?
A higher peak is observed
around 03h UTC. This region of the sky contains many radio sources but trying
to identify which one could be responsible for this fluctuation, we find two
possible sources, named PKS0336-01 (2423mJy) and 3C89 (2200mJy).
 |
| Little peace of Catalogue of radio sources near 1420 MHz with information about PKS0336 and 3C89 |
 |
| Plot of detector data with unshadowed area around 05h Local or 03h UTC |
 |
| Sky at 03h UTC on 7th Sep 2015 |
3° above Orion
Scanning some degrees above Orion we still receive radiation from 3C145 (M42), very faint but perceptible.
 |
| Transit of the area 3° above Orion |
 |
| Sky on 7th Sept 2015 at 04h 40' UTC for RA 05h 57' DEC -2° 22' (Antenna Focus) |
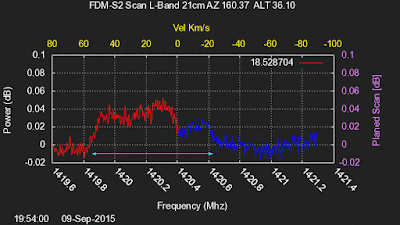
Following plots provide a view of the spectrum between 1420 and 1421 MHz The bottom X-axis contains the frequency values.
The Y-axis shows the calculated signal power in decibel. The top X-axis shows
the corresponding radial speed for every frequency value without correction. This correction should take into account
the influence of several speed components coming from Earth rotation around own
axis, earth rotation around the solar
system barycenter and solar system rotation around our galaxy barycenter.
 |
| Transit of Milky Way by Galactic Coordinate Lat 0° Long 215° |
 |
| Transit of Milky Way by Galactic Coordinate Lat 0° Long 35° |
http://www.germersogorb.de/html/lbandlive.html


