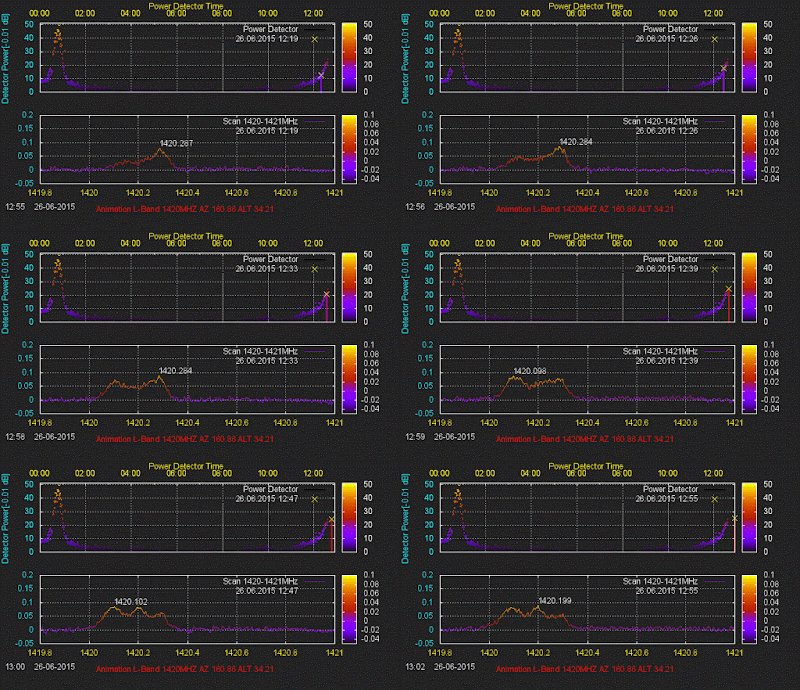
Sonntag, 13. September 2015

Scanning the sky by 1420 MHz with FDM-S2

Searching for signals

Current scanned Sky

For this analysis logged data of some days of September 2015 were taken, with the purpose of finding out if there is any significant radio source detectable with the previously described (see older post) handmade radio telescope and a 4m diameter parabolic dish. A complete sky scan is being made, which will probably take some weeks (or even months). Within this post we take first a look on declination -2° 22'.


Declination -2° 22' 

The following plot shows the software detector data for the 7th September 2015.

24 Hours Plot of 7th September 2015 for DEC -2° 22'


The plot includes two different representations of the recorded data in these 24 hours. The X-axis contains the timestamp in local form. The Y-axis of the upper plot shows the calculated power in every scan on basis of a developed algorithm, which makes a conversion of the real scan (1420 to 1421MHz) to a flatted scan, tries to recognize the existence of a signal on it and integrates the area of the found signal as a result. For the current scanned sky position (RA-DEC) a possible detectable radio source extracted from 1420MHz catalogue in http://vizier.cfa.harvard.edu/ is logged and shown vertically (mostly not really readable on a 24 hours plot). The color of the text depends on the flux of the source, in Jy. The plot below shows in the left Y-axis the frequency band of found signal on scan, with his corresponding bandwidth on the right side.

For a better recognition of detected radio sources it is always necessary a comparison of data of different days, so that the expected time shifting of 4 minutes per day is obvious. The next picture includes the 7th and 9th September:

24 Hours Plot of 7th and 9th September 2015

00h 25min UTC, 3C29 ?
A catalogue of radio sources on 1420 MHz indicates for 3C29 (RA 00h 55min and DEC -01° 42') a Flux of 7Jy.

Radio Sources Catalogue extract with 3C29
The signal detected on 1420.5 MHz that produces the little broad peak on the detector curve is shown here. Time of Scan is 00h 25' 37'' UTC.

Scan 7th Sep 2015 at 00h25min19sec on RA 00h 25min DEC -2° 22'

Sky on 7th Sept 2015 at 00h 25' 37'' UTC for RA 00h 55' DEC -2° 22' (Antenna Focus)


02h 13in UTC, 3C71 ?
Observing the time period between 02:00 and 02:30 UTC we appreciate the peak caused by a signal centered on 1420.5 MHz. The sky view on this time for the scanned area shows several sources, being the starkest one 3C71 or M77 (NGC 1068). This source still lies more than 1° above the antenna focus. 

Zoom of plot for a better analysis around 04:13 local or 02:13 UTC

A search through the scanned area with planetarium software lets us guess it could be M77 or even 023507-040205, a very faint radio source, catalogued with just 1495.3 mJy. 

Sky on 7th Sept 2015 at 02h 13'  UTC for RA 02h 55' DEC -2° 22' (Antenna Focus)

PSK0336-01, 3C89 ?
A higher peak is observed around 03h UTC. This region of the sky contains many radio sources but trying to identify which one could be responsible for this fluctuation, we find two possible sources, named PKS0336-01 (2423mJy) and 3C89 (2200mJy). 

Little peace of Catalogue of radio sources near 1420 MHz with information about PKS0336 and 3C89

Plot of detector data with unshadowed area around 05h Local or 03h UTC

Sky at 03h UTC on 7th Sep 2015


3° above Orion
Scanning some degrees above Orion we still receive radiation from 3C145 (M42), very faint but perceptible. 

Transit of the area 3° above Orion
Sky on 7th Sept 2015 at 04h 40' UTC for RA 05h 57' DEC -2° 22' (Antenna Focus)


Milky Way transits


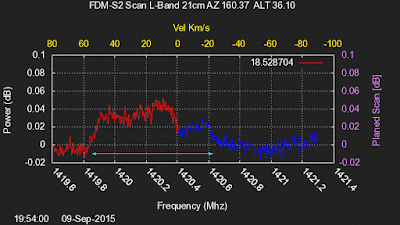
Following plots provide a view of the spectrum between 1420 and 1421 MHz The bottom X-axis contains the frequency values. The Y-axis shows the calculated signal power in decibel. The top X-axis shows the corresponding radial speed for every frequency value without correction. This correction should take into account the influence of several speed components coming from Earth rotation around own axis,  earth rotation around the solar system barycenter and solar system rotation around our galaxy barycenter. 

Around 5:50h UTC (7:50 Local) we detect the transit of the Milky Way by the galactic coordinates Lat 0° Long 214°.
Transit of Milky Way by Galactic Coordinate Lat 0° Long 215°
and around 18h UTC (20h Local) by Lat 0° Long 35°
Transit of Milky Way by Galactic Coordinate Lat 0° Long 35°

http://www.germersogorb.de/html/lbandlive.html

Sonntag, 28. Juni 2015

Radio astronomy with FDM-S2

FDM-S2 Support

Unfortunately the software supplied by ELAD for the FDM-S2 did not cover my need for radio astronomy. There is no option there for saving permanently scans, in for example csv files, therefore you are forced to work with wav file, what requires a great amount of storage. On the ELAD site http://sdr.eladit.com/FDM-S2%20Sampler/ you can find several DLLs for taking IQ samples, which you can posteriorly transform to frequency domain and finally save in csv files. This was the target of this software.

Block Diagramm of the software

Possible application

FMD-S2-Samples

This application controls the FDM-S2 and works as an interface for the Callback routine. Thanks to the document "SPECIFICATION FOR EXTERNAL USE of I/O DLLs TO COMMUNICATE TO FDM DEVICE" it was possible to implement a code for making all setting prior to calling the Callback function. This was compiled with Visual Studio Express VC10. Via config file and the option -c you can set following parameters:

Sampler  
Set the DLL for the sampling. Every DLL works with a fixed sampling rate. ELAD supplies six DLLs:
  • ExtIO_ELAD_FDMS2_192k_v3_04.dll for 192 k Sample output data rate.
  • ExtIO_ELAD_FDMS2_384k_v3_04.dll for 384 k Sample output data rate. 
  • ExtIO_ELAD_FDMS2_768k_v3_04.dll for 768 k Sample output data rate.
  • ExtIO_ELAD_FDMS2_1536k_v3_04.dll for 1536 k Sample output data rate. 
  • ExtIO_ELAD_FDMS2_3072k_v3_04.dll for 3072 k Sample output data rate. 
  • ExtIO_ELAD_FDMS2_6144k_v3_04.dll for 6144 k Sample output data rate.


Every DLL returns a fixed amount of samples:
  • For 192k DLL return value is 12288 complex samples.
  • For 384k DLL return value is 12288 complex samples.
  • For 768k DLL return value is 12288 complex samples.
  • For 1536k DLL return value is 12288 complex samples.
  • For 3072k DLL return value is 49152 complex samples.
  • For 6144k DLL return value is 49152 complex samples.

Scan Frequency
Initial sampling frequency. The bandwidth is determined by the chosen DLL and defines the end frequency.
Permanence
This value sets the amount of sets of complex samples we want to take for every scan. It means, for a value of 300 and DLL ExtIO_ELAD_FDMS2_6144k_v3_04.dll you get 300x49152=14.7 millions of samples.
Shift Counter
This parameter sets the amount of frequency shifting after having taken the required amount of samples for every given initial frequency (determined by permanence). The offset for shifting is just a part of the bandwidth and it is configurable in the file fdm-s2-samples.cpp under the struct fdm. All parameters associated with a DLL are defined in this structure.

Download


FFT of IQ Data: fdm_s2_fft.py

This application reads the IQ samples file/s, extracts all parameter set by fdb-s2-samples coded in a binary header and makes a DSP (Power Spectral Density, matlab), for getting finally the frequency spectrum. The FFT settings can be changed in the file fdm_s2_fft.py. After this, the spectrum will be plotted and all Frequency-Power pairs will be written in a csv file, for any posterior use.
The application was implemented with Python 2.7. Python supplies an easy way of installing packages by demand, so you just have to call the script and all needed modules not installed yet will print an information error. You can bit a bit get the required environment for this application.


Used variables are predefined but will be overwritten with the information found in the decoded binray header of the IQ samples file. Hier the variables:

FREQUENCY_DEFAULT = 30000000                            #30MHz
NFFT = 8192                                                                          # FFT Size
BLOCK = 12288                                                                   #FDM-S2
BANDBREITE_384K = 100000                                        #Hz
BANDBREITE_3M = 700000                                            #Hz
BANDBREITE_6M = 3000000                                         #Hz
PERMANENCE = 20                                                           # Permanence in fdm-s2-samples.cpp
SHIFT_CYCLE = 10                                                            # Shift Counter in fdm-s2-samples.cpp
BANDBREITE = BANDBREITE_6M          
SAMPLE_RATE = 384000                                                #With the FDM-S2 384K DLL for 32Bit
                                                                                                 # see "Sample output data rate" for every FDM-S2 DLL 
GAUSS_FILTER_FACTOR = 2                                        #Smoothing of Power Values. Factor 2 is very light.
PATH_OF_SAMPLING_FILES = ".\\RawFiles\\"          #Input Files
PATH_OF_OUTPUT_FILE = ".\\"                     
START_FREQ = 1419.6                                                    # Start Frequency for Output Data
END_FREQ = 1421.3                                                         # End Frequency for Output Data


Change the following code line. because this was implemented for taking into account the Down Converting shift on my own system
handle.write("{0},{1}\n".format((1392+freq/1000000), smooth_gauss[smooth_cnt]))


Download


Samstag, 27. Juni 2015

Radioastronomía con FDM-S2

FDM-S2 Support para Radioastronomía

El software suministrado por ELAD para el uso del receptor FDM-S2 no permite almacenar los espectros en forma de ficheros csv. Por lo tanto uno está limitado a trabajar con wav, lo que requiere mucho espacio de almacenamiento. En la página http://sdr.eladit.com/FDM-S2%20Sampler/ se encuentran diversas DLLs, con las que se puede utilizar el receptor para recoger muestras IQ, transformarlas al dominio de la frecuencia y finalmente almacenarlas en ficheros csv. Con este fin se implementó el software aquí descrito.

Diagrama de bloques del software para uso en Radioastronomía
Posible aplicación para los datos extraidos

FMD-S2-Samples

La aplicación controla el FDM-S2 y representa la interfaz para la función CallBack. Con ayuda del documento "SPECIFICATION FOR EXTERNAL USE of I/O DLLs TO COMMUNICATE TO FDM DEVICE" se pudo implementar un código que realiza las configuraciones previas a la llamada CallBack. El código ha sido compilado con Visual Studio Express VC10. El fichero de configuración se le pasa al ejecutable con la opción -c y proporciona configurabilidad para los siguientes parámetros:

Sampler  
Aquí indicamos qué DLL ha de emplearse para recoger las muestras IQ. Con el uso de una u otra DLL se decide la frecuencia de muestreo. ELAD proporciona las siguientes DLLs:

  • ExtIO_ELAD_FDMS2_192k_v3_04.dll for 192 k Sample output data rate.
  • ExtIO_ELAD_FDMS2_384k_v3_04.dll for 384 k Sample output data rate. 
  • ExtIO_ELAD_FDMS2_768k_v3_04.dll for 768 k Sample output data rate.
  • ExtIO_ELAD_FDMS2_1536k_v3_04.dll for 1536 k Sample output data rate. 
  • ExtIO_ELAD_FDMS2_3072k_v3_04.dll for 3072 k Sample output data rate. 
  • ExtIO_ELAD_FDMS2_6144k_v3_04.dll for 6144 k Sample output data rate.


La DLL escogida fija la cantidad de muestras extraibles:

  • For 192k DLL return value is 12288 complex samples.
  • For 384k DLL return value is 12288 complex samples.
  • For 768k DLL return value is 12288 complex samples.
  • For 1536k DLL return value is 12288 complex samples.
  • For 3072k DLL return value is 49152 complex samples.
  • For 6144k DLL return value is 49152 complex samples.

Scan Frequency
Frecuencia de muestreo inicial. El ancho de bada del muestreo está implicitamente determinado por la DLL escogida y determina así la frecuencia final.
Permanence
Este valor indica cuántos Sets completos de muestras IQ complejas queremos recoger por cada Scan. Por ejemplo un valor de 300 y la DLL ExtIO_ELAD_FDMS2_6144k_v3_04.dll resulta en 300x49152=14.7 millones de muestras.
Shift Counter
Este parámetro determina la cantidad de desplazamientos a partir de la frecuencia inicio tras finalizar un muestreo (determinado por Permanence). Cada desplazamiento se hará con un offset con respecto a la frecuencia inicial, que es una parte (configurable) del ancho de banda de la DLL escogida.
La definición completa de una DLL con todos los parametros previamente configurados pero editables se encuentra en el fichero fdm-s2-samples.cpp en la estructura fdm.

Download


FFT de muestras complejas: fdm_s2_fft.py

Esta aplicación lee el/los fichero/s Raw de muestras IQ, extrae los parámetros configurados y codificados en binario por fdb-s2-samples y realiza la DSP (Power Spectral Density, matlab), para generar finalmente el espectro de frecuencias, Los parámetros de la FFT se pueden cambiar en el archivo fdm_s2_fft.py. Después de esto se hace una representación gráfica del espectro y se guardan todos los pares Frecuencia-dB en un fichero csv para su uso posterior.
La aplicación da sido implementada con Python 2.7. Al ejecutar el script, todos los módulos requeridos que no hayan sido instalados previamente, producirán un mensaje de error. De esta forma es sencillo ir descubriendo poco a poco los paquetes necesarios para ejecutar el script.

Las variables empleadas tienen valores predefinidos, pero que se sobreescriben al leer la cabecera binaria de los ficheros de muestras complejas IQ. Los parámetros son los siguientes:

FREQUENCY_DEFAULT = 30000000                            #30MHz
NFFT = 8192                                                                          # FFT Size
BLOCK = 12288                                                                   #FDM-S2
BANDBREITE_384K = 100000                                        #Hz
BANDBREITE_3M = 700000                                            #Hz
BANDBREITE_6M = 3000000                                         #Hz
PERMANENCE = 20                                                           # Permanence in fdm-s2-samples.cpp
SHIFT_CYCLE = 10                                                            # Shift Counter in fdm-s2-samples.cpp
BANDBREITE = BANDBREITE_6M          
SAMPLE_RATE = 384000                                                #With the FDM-S2 384K DLL for 32Bit
                                                                                                 # see "Sample output data rate" for every FDM-S2 DLL 
GAUSS_FILTER_FACTOR = 2                                        #Smoothing of Power Values. Factor 2 is very light.
PATH_OF_SAMPLING_FILES = ".\\RawFiles\\"          #Input Files
PATH_OF_OUTPUT_FILE = ".\\"                     
START_FREQ = 1419.6                                                    # Start Frequency for Output Data
END_FREQ = 1421.3                                                         # End Frequency for Output Data


La linea del código donde se convierten los valores de la frecuencia, corrijen los desplazamientos de la senal procedentes del Down Converter y debe ser cambiada o eliminada según el uso. 
handle.write("{0},{1}\n".format((1392+freq/1000000), smooth_gauss[smooth_cnt]))


Download


Radioastronomie mit dem FDM-S2

FDM-S2 Support für Radioastronomie


Leider ist die mit der FDM-S2 mitgelieferte Software nicht für meine Radioastronomie Zwecke geeignet, da man kaum Daten sammeln kann, ohne einen riesigen Speicherplatz zur Verführung zu haben. Die auf der ELAD Seite zum herunterladen stehende DLLs (http://sdr.eladit.com/FDM-S2%20Sampler/lassen sich einfach nutzen und machen es möglich,Samples zu sammeln, zu transformieren und zu speichern in einer etwas günstigeren Variante. Die hier beschriebene Software macht das.
Blockdiagramm der Software


Mögliche Anwendung der CSV Files (hier gnuplot), nach dem Scan Falttener.


FMD-S2-Samples

Diese Applikation steuert den FDM-S2 und stellt die Schnittstelle für die CallBack Funktion dar. Mit Hilfe des Dokumentes "SPECIFICATION FOR EXTERNAL USE of I/O DLLs TO COMMUNICATE TO FDM DEVICE" wurde ein Code implementiert, mit dem die Voreinstellungen des Gerätes durchgeführt werden können, bevor die CallBack Funktion aufgerufen wird. Der Code wurde mit Visual Studio Express VC10 kompiliert. Ein Konfigurationsfile wird mit der Option -c eingegeben und stellt folgende Parameter zur Verführung:

Sampler  
Hier ist gemeint, welches DLL für die IQ Samples genommen werden soll . Mit der DLL legt man den Ausgang Sample Rate des FDM-S2 fest. ELAD stellt diese zur Verfügrung:

  • ExtIO_ELAD_FDMS2_192k_v3_04.dll for 192 k Sample output data rate.
  • ExtIO_ELAD_FDMS2_384k_v3_04.dll for 384 k Sample output data rate. 
  • ExtIO_ELAD_FDMS2_768k_v3_04.dll for 768 k Sample output data rate.
  • ExtIO_ELAD_FDMS2_1536k_v3_04.dll for 1536 k Sample output data rate. 
  • ExtIO_ELAD_FDMS2_3072k_v3_04.dll for 3072 k Sample output data rate. 
  • ExtIO_ELAD_FDMS2_6144k_v3_04.dll for 6144 k Sample output data rate.


Je nach dem welcher DLL genommen wird, ist die Menge Samples auch fest.

  • For 192k DLL return value is 12288 complex samples.
  • For 384k DLL return value is 12288 complex samples.
  • For 768k DLL return value is 12288 complex samples.
  • For 1536k DLL return value is 12288 complex samples.
  • For 3072k DLL return value is 49152 complex samples.
  • For 6144k DLL return value is 49152 complex samples.

Scan Frequency
Erste Frequenz, ab der das Signal abgetastet wird. Die Bandbreite ist vom jeder DLL abhängig und legt damit die letzte Frequenz fest.
Permanence
Der Wert sagt, wie viele komplette "Complex Samples" Sätze pro Scan gesammelt werden . Zum Beispiel, ein eingestellter Wert von 300 mit der ExtIO_ELAD_FDMS2_6144k_v3_04.dll entspricht 300x49152=14.7 Millionen Samples.
Shift Counter
Dieser Wert entspricht die Menge der Verschiebungen der Start Frequenz, nach dem Erreichen der gewünschten Anzahl von Samples. Der Offset bei jeder Verschiebung ist ein (einstellbarer) Prozentsatz der Bandbreite vom ausgewählten DLL. Die Eigenschaften jedes DLLs sind im File fdm-s2-samples.cpp mittels einer Struktur namens fdm definiert.

Download


FFT von IQ Data: fdm_s2_fft.py

Diese Applikation liest das/die Raw IQ-Data File/s, extrahiert daraus die binär codierten Einstellparameter und führt eine DSP (Power Spectral Density, matlab) durch, um aus den IQ Daten das Spektrum zu generieren, Die FFT Einstellungen können im File fdm_s2_fft.py geändert werden. Das Spektrum wird dann dargestellt und alle berechneten Frequenz-Leistung Paare werden in ein csv File geschrieben, für eine spätere Nutzung.
Die Applikation wurde mit Python 2.7 implementiert. Beim Ausführen des Python Skriptes, werden die benötigten und nicht vorinstallierten Module in Form von Fehlermeldungen angezeigt. Python bietet aber eine sehr bequeme Möglichkeit, um bei Bedarf Module online zu installieren.

Die im Skript verwendete Variablen haben voreingestellte Werte, die beim Lesen der IQ-Files je nach eingefügtem Binär Header (siehe oben fdm-s2-sampler) überschrieben werden.

FREQUENCY_DEFAULT = 30000000                            #30MHz
NFFT = 8192                                                                          # FFT Size
BLOCK = 12288                                                                   #FDM-S2
BANDBREITE_384K = 100000                                        #Hz
BANDBREITE_3M = 700000                                            #Hz
BANDBREITE_6M = 3000000                                         #Hz
PERMANENCE = 20                                                           # Permanence in fdm-s2-samples.cpp
SHIFT_CYCLE = 10                                                            # Shift Counter in fdm-s2-samples.cpp
BANDBREITE = BANDBREITE_6M          
SAMPLE_RATE = 384000                                                #With the FDM-S2 384K DLL for 32Bit
                                                                                                 # see "Sample output data rate" for every FDM-S2 DLL 
GAUSS_FILTER_FACTOR = 2                                        #Smoothing of Power Values. Factor 2 is very light.
PATH_OF_SAMPLING_FILES = ".\\RawFiles\\"          #Input Files
PATH_OF_OUTPUT_FILE = ".\\"                     
START_FREQ = 1419.6                                                    # Start Frequency for Output Data
END_FREQ = 1421.3                                                         # End Frequency for Output Data


* Die Korrektur der Frequenz Werten vor dem Speichern ins File, berücksichtigt die Frequenzverschiebung vom Down Converter und muss für jeden Anwender geändert oder ganz eliminiert werden
handle.write("{0},{1}\n".format((1392+freq/1000000), smooth_gauss[smooth_cnt]))


Download